
REACT · TYPESCRIPT · GITHUB API
Public repositories.
A diagnosis that can defend itself.
GitHub Profile Analyzer turns hard-to-read public activity into an explainable diagnosis: evidence, criteria, recommendations and a recruiter goal stay in one conversation.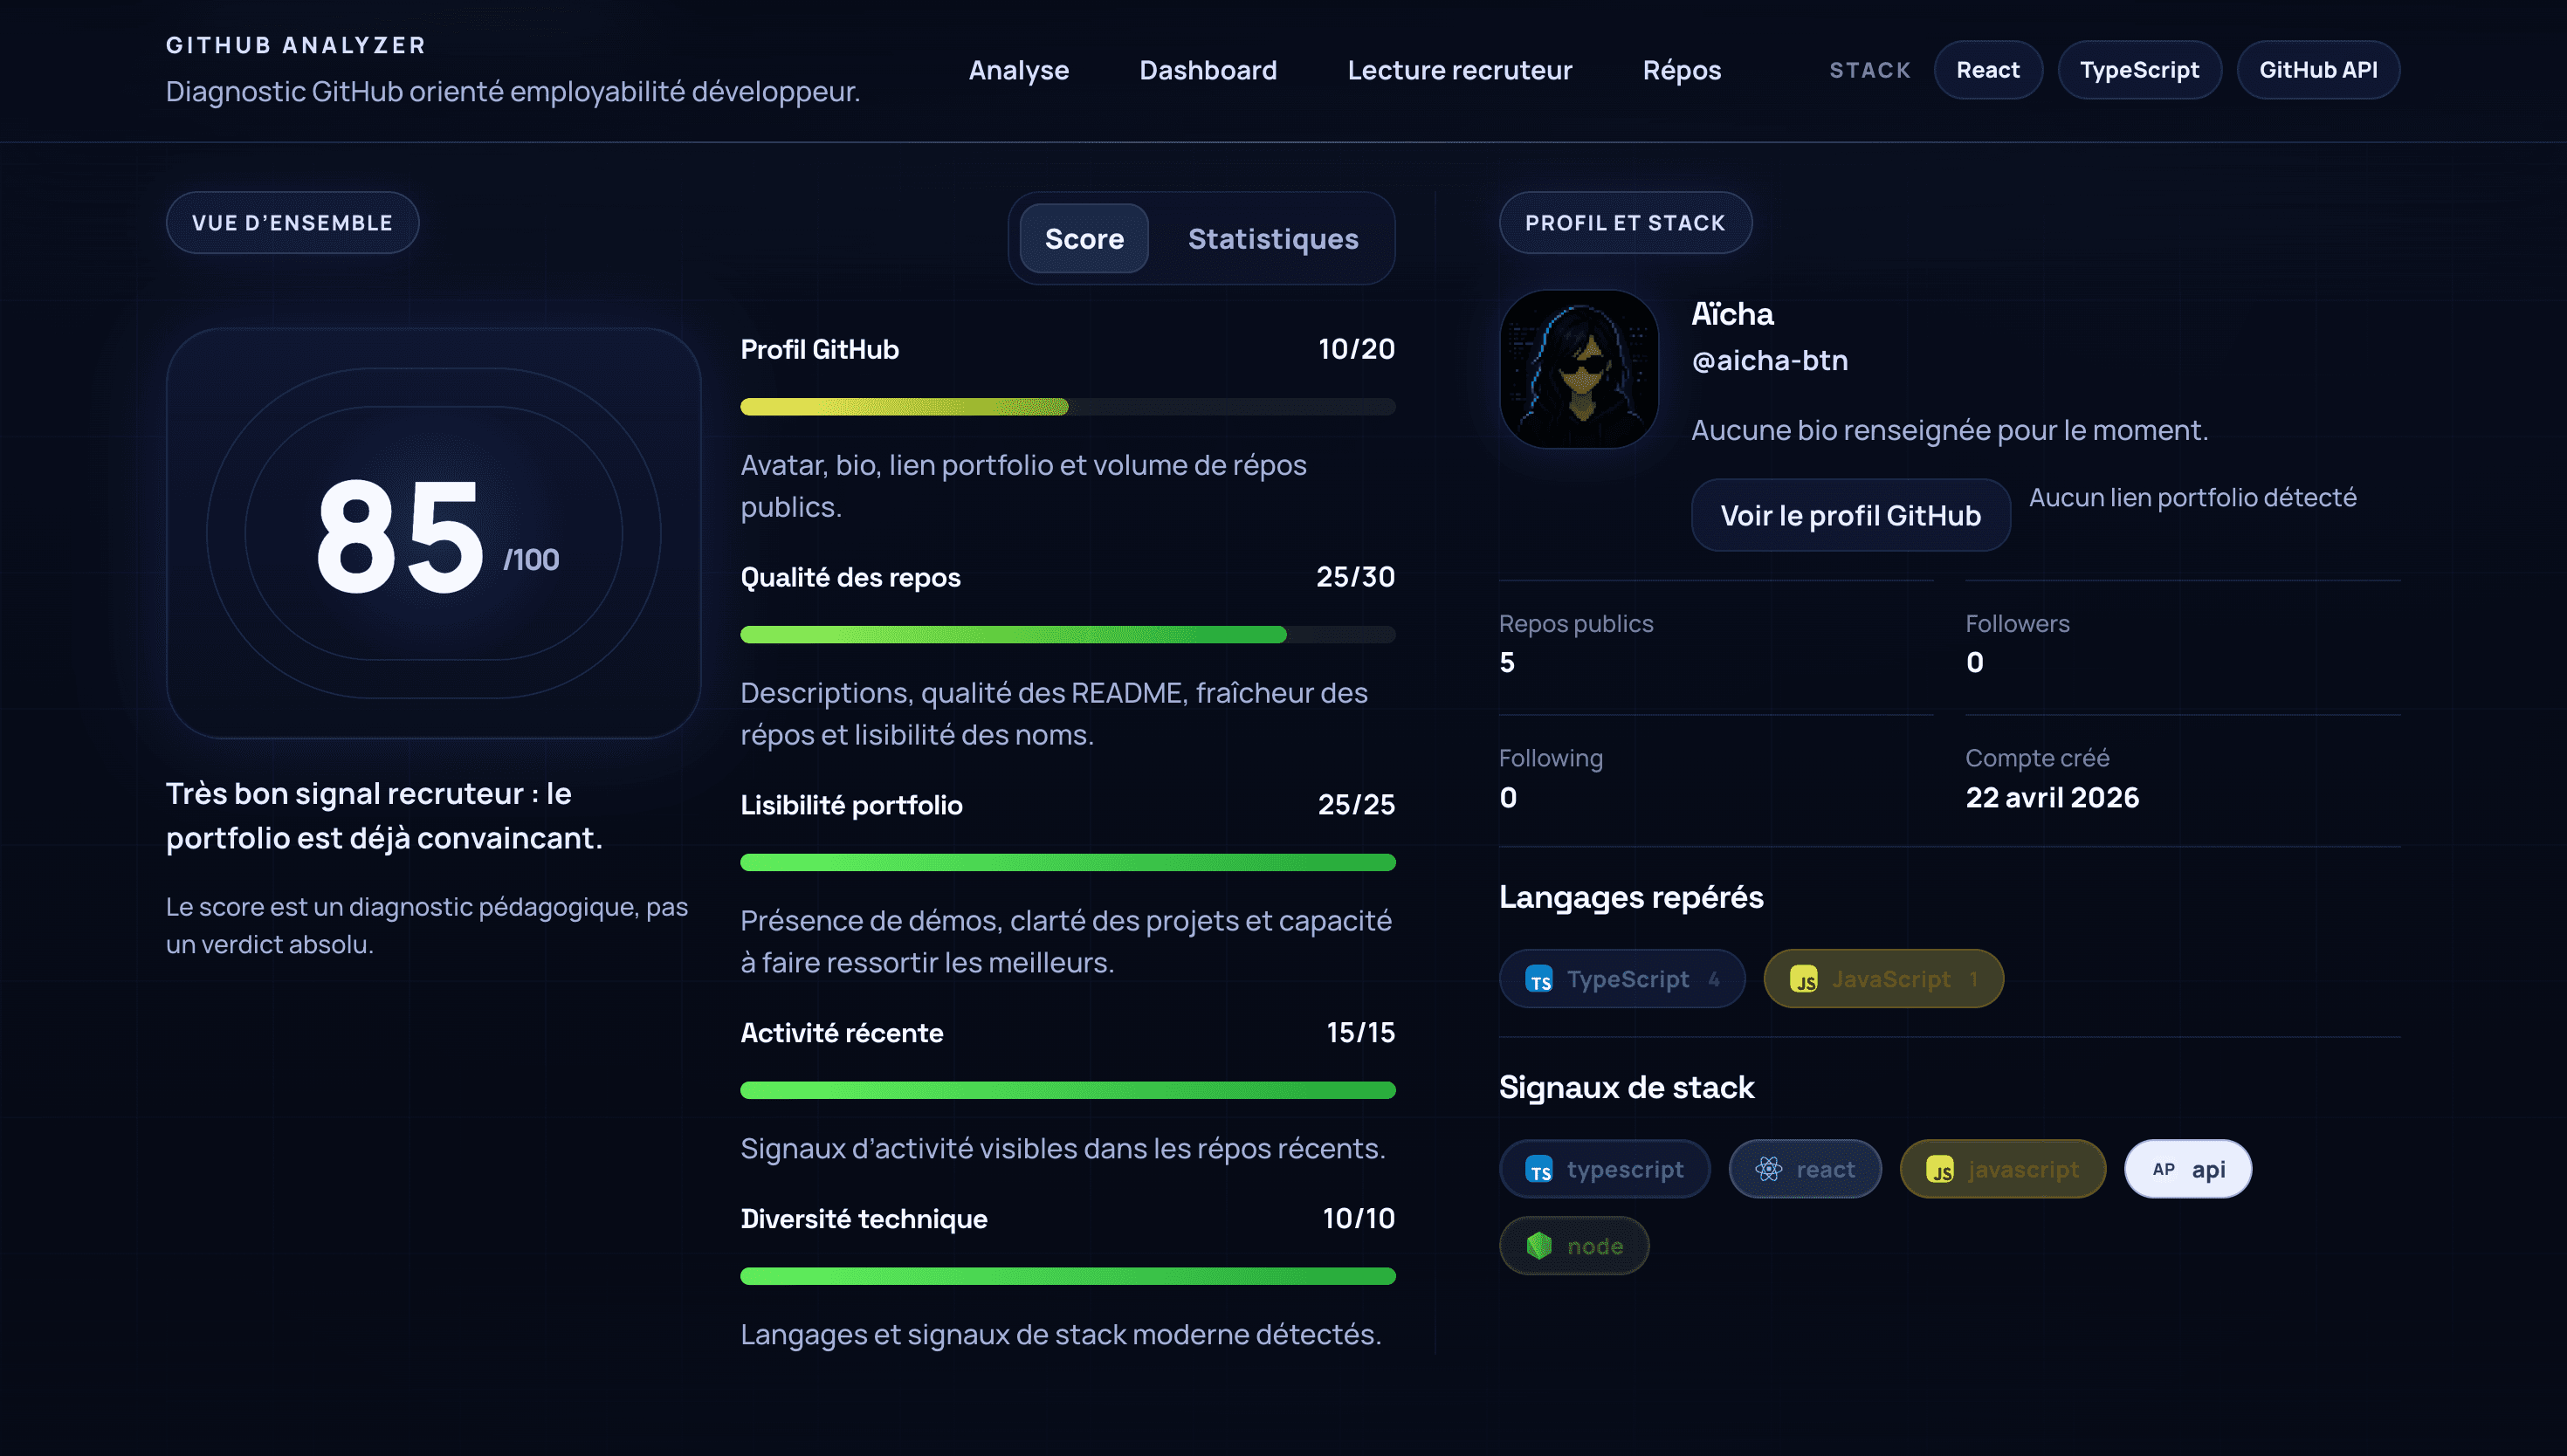
The product does not decide in a recruiter's place. It makes signals verifiable, then gives the candidate a starting point to improve them.
A GitHub profile says a lot. It is not quick to read.
Bio, README, demos, activity and technical choices are useful but fragmented clues. The challenge was to make them readable without turning them into an opaque verdict.
- Visible projects
- Explained criteria
- Actionable next steps
Collect less. Interpret better.
The analysis uses public GitHub data, then limits detailed inspection to the most relevant repositories. Results stay quick and respectful of request limits.
- 01GitHub APIPublic profile and repositories
- 02NormalizeNames, dates, stacks, demos
- 03SelectThe most relevant repositories
- 04InspectREADME and delivery evidence
- 05ExplainScore, criteria and recommendations
100 points. No opaque verdict.
The real engine calculates a score from readable rules. The case study below uses a fixed 99/100 scenario to explain the rubric: this portfolio page does not recompute the metric.
GitHub profile
20 / 20Avatar, bio, portfolio link and public repository volume.
Repository quality
30 / 30Descriptions, README, recency and readable names.
Portfolio readability
25 / 25Visible demos, highlighted projects and useful context.
Recent activity
15 / 15Activity signals across recent repositories.
Technical diversity
9 / 10Detected languages and modern stack signals.
The same profile reads differently for each role.
The product adapts signal ordering and recommendations to the selected goal without changing the observed data.
Frontend apprenticeship
For a frontend profile, the reading starts with interface quality, demos, React, TypeScript and UI practices.
ReactTypeScriptFrontendCSS / UIAPI
The main expectations are already covered.
72% and 100% are demonstration values illustrating how the reading changes by role; they are not recomputed on this page.
Choose the right reading depth.
Quick for a first signal, deep to read relevant repository README files, local to present the product without consuming the GitHub API.
QUICK
Reads essential signals without multiplying README requests.
DEEP
Inspects the README files of the most relevant repositories to deepen the reading.
LOCAL DEMO
Lets visitors explore the interface without an external request or network dependency.
A score matters when you can trace it back to its source.
The real engine sorts repositories returned by the GitHub API. The cards below are coded examples that demonstrate inspectable evidence: description, README, demo, activity and stack.
github-analyzer
React TypeScript dashboard that analyzes a GitHub profile and proposes a portfolio diagnosis.
- Clear description
- README detected
- Demo available
alternance-tracker
Application tracker with filters, statuses and a responsive dashboard.
- Professional README
- Demo available
- Recent
weather-brief
Small weather application connected to a public API and its loading states.
- Visible stack
- Features
- Demo available
quittance-app
Rent receipt generator with a clear form and PDF export.
- Clear description
- README detected
- Demo to strengthen
Boundaries are part of the experience.
A missing profile, a GitHub limit or an unavailable connection should not turn the interface into a dead end.
Profile not found
The username is checked and the message offers a clear next action.
Visible API limit
The GitHub limit is explained instead of leaving the screen without an answer.
Demo available
Local data keeps the experience demonstrable without the network.
The method should learn from real hiring situations.
I would challenge weighting with recruiters and candidates, publish a versioned methodology, then measure whether recommendations actually make a portfolio easier to understand.